



Delhi’s Diwali pollution decoded: Firecrackers accounted for 71%, vehicles 7%
HT's analysis of CPCB's records shows fine-dust readings at many stations stopped just short of 1,000 µg/m³ while their gas monitors kept reporting. from Hindustan Times
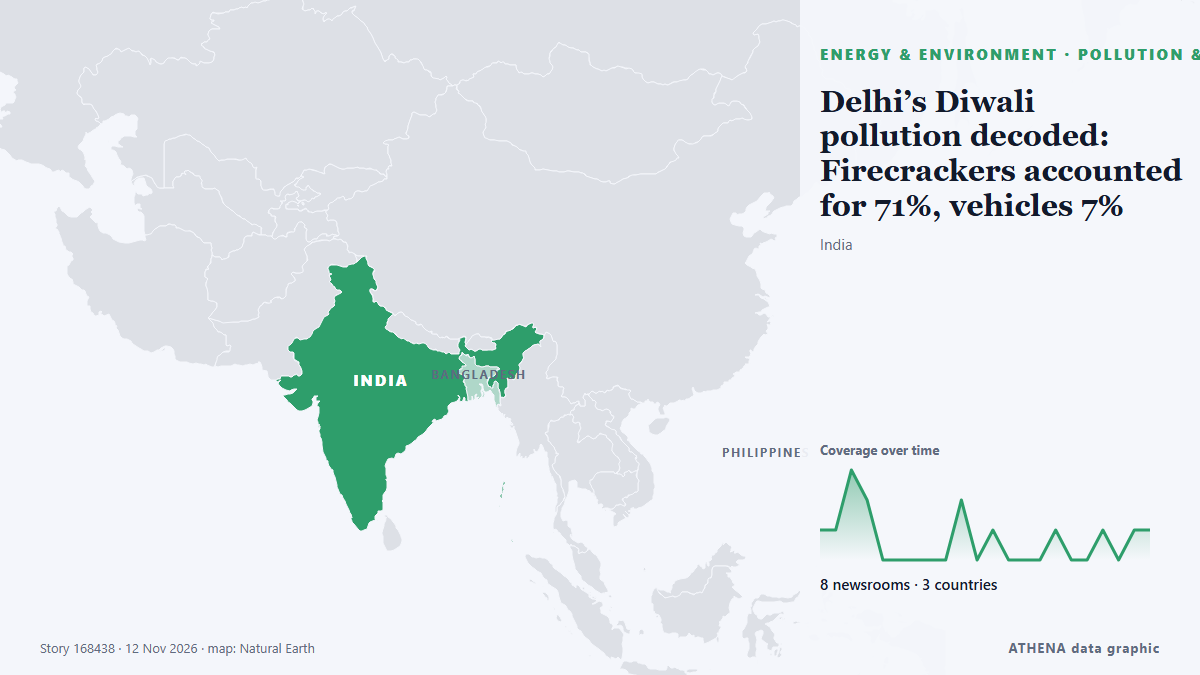
Reported independently by 8 outlets in 3 countries since 9 Nov, first by Hindustan Times; coverage is fading. ATHENA rates the risk moderate (3.4/10), driven mainly by the severity of the harm described and the quality of the evidence. Confidence is 80% (high), with 8 independent outlets corroborating it and an average source reliability of 68%. Outlets by country: India (12), South Africa (1), Japan (1). Coverage: 9 Nov to 12 Nov, 66 hours.
Why it matters: Energy and resource developments affect fuel and power prices, supply security and climate commitments.
What changed: 4 new reports from 4 outlets in the 24 hours to 12 Nov.
First reported as: On Diwali night, Delhi's PM2.5 readings climbed towards 1,000, then went blank
AutomatedSelected, grouped and scored by ATHENA's published method from 8 independent outlets. The headline is the outlet's own; ATHENA's sentences follow fixed patterns - no generative AI writes them. How it works →
How to read this page
- What you are reading
- 8 outlets in 3 countries reported this event. The reports below are listed in the order they appeared; each headline opens the original article. ATHENA writes none of the reports.
- Our reading
- For the record — The reports describe a completed, domestic, commercial or personal matter. We list it so you can see who reported it and when. We are not tracking a risk of wider conflict here.
- How much evidence
- Limited Treat this page as an early report.
After repeats, off-topic items and stale reports are removed, 8 of the 14 listed reports are counted; 100% of the headlines match the event.
- What this does not mean
- ATHENA measures how an event is reported, not whether it is true. This is not a forecast, a judgement on who is right, or advice.
- What would change it
- Reports from other independent outlets showing a different development, or a firm confirmation or denial from an official source.
Reading R2 · refreshed with every update of this page. ATHENA has not yet published a track record for these readings; when it does, it will be linked here.
At a glance
Selected, scored and written by ATHENA's published methodology. No editor intervenes in individual events. How this is produced ›
| 09 Nov 07:12 UTC | 1 |
|---|---|
| 09 Nov 10:12 UTC | 1 |
| 09 Nov 13:12 UTC | 3 |
| 09 Nov 16:12 UTC | 2 |
| 09 Nov 19:12 UTC | 0 |
| 09 Nov 22:12 UTC | 0 |
| 10 Nov 01:12 UTC | 0 |
| 10 Nov 04:12 UTC | 0 |
| 10 Nov 07:12 UTC | 0 |
| 10 Nov 10:12 UTC | 2 |
| 10 Nov 13:12 UTC | 0 |
| 10 Nov 16:12 UTC | 1 |
| 10 Nov 19:12 UTC | 0 |
| 10 Nov 22:12 UTC | 0 |
| 11 Nov 01:12 UTC | 0 |
| 11 Nov 04:12 UTC | 1 |
| 11 Nov 07:12 UTC | 0 |
| 11 Nov 10:12 UTC | 0 |
| 11 Nov 13:12 UTC | 1 |
| 11 Nov 16:12 UTC | 0 |
| 11 Nov 19:12 UTC | 1 |
| 11 Nov 22:12 UTC | 1 |
| 09 Nov 11:39 UTC | 0.0 |
|---|---|
| 09 Nov 19:19 UTC | 0.9 |
| 10 Nov 15:53 UTC | 2.6 |
| 12 Nov 01:22 UTC | 3.4 |
| 12 Nov 01:22 UTC | 3.4 |
Why these numbers
Importance
Risk
Confidence
The reporting — who reported it, and when
headline as published · opens the original- Hindustan Times · IndiaOn Diwali night, Delhi's PM2.5 readings climbed towards 1,000, then went blank
- NDTV · IndiaJust 30 km From Delhi, Air In This UP Town Is Among Most Polluted In World
- IOL · South AfricaDelhi pollution levels soar to nearly 59 times WHO limit after Diwali fireworks
- Hindustan Times · IndiaHT Evening News Brief November 9: Delhi's PM2.5 readings go blank on Diwali night; Sheikh Hasina seeks passport to return to Bangladesh
- Hindustan Times · IndiaDelhi’s missing Diwali night data released; PM2.5 at over 60 times national standard
- Deccan Herald · IndiaAnother Diwali, same toxic tale: Delhi chokes as curbs go up in smoke
- NDTV · IndiaExperts Explain Why Delhi's Air Quality Monitors Went Blank On Diwali Night
- The Diplomat · JapanIndia’s Diwali: How Irresponsible Celebrations Spoil the Festival for Many
- Deccan Herald · IndiaDelhi's Diwali pollution puzzle: Updated data shows massive spikes, gaps remain
- Indian Express · IndiaDelhi’s Diwali pollution decoded: Firecrackers accounted for 71%, vehicles 7%
- Hindustan Times · IndiaFirecrackers were responsible for 71% of air pollution on Diwali night in Delhi: Study
- Scroll.in · IndiaDiwali firecracker pollution ‘not a problem’, says Adityanath
- Times of India · IndiaComplete data could've raised average Delhi Diwali pollution level by 49%
- Indian Express · IndiaDiwali over. 3 days on, firecrackers among prominent PM2.5 pollution sources in Delhi